Jobs Report November update
I last looked at the H-Net job numbers about a month ago.
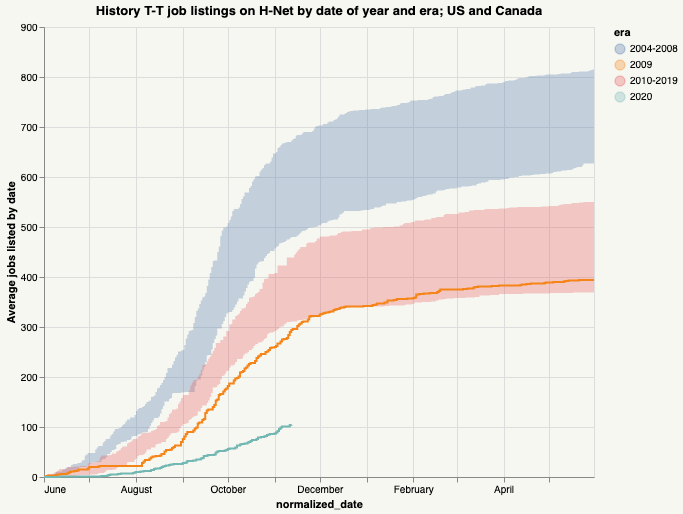
Since then, the news isn’t exactly good, but it’s also probably as good as anyone could expect. For most of September and October, history jobs were at about 25% of their average for the 2010s; this was slightly worse than we’re seeing in the approximate numbers in–for instance–science jobs, where new job openings are at about 30% of their normal levels (Thanks to Dylan Ruediger at the AHA for passing along that link.)
The shifts in the last month have pushed the totals numbers over 100 jobs in history; this is a bit of an advance, so we’re now down only about 70% from the normal rates, not 75%. I don’t know if the sciences have seen a similar rebound.

Cumulative jobs by era
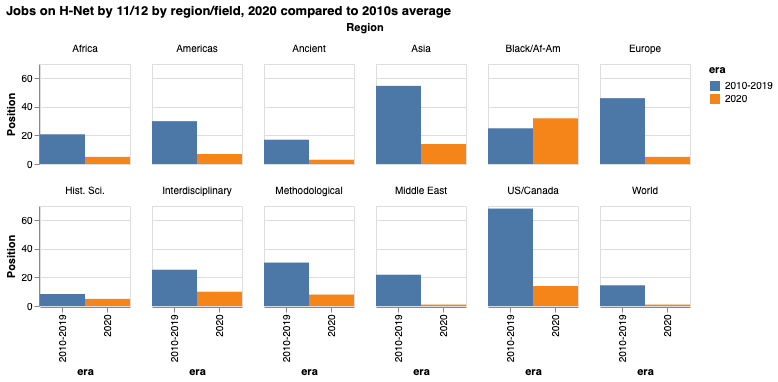
We’re far enough into the year that it’s worth looking at subfield numbers to see how different fields are faring. The loss of jobs is much more uneven than I thought.
At one extreme, jobs in world history and Middle Eastern history are down about 95%; at the other end, there have been 32 jobs listed with a primary category of Black studies or African American studies, an increase of 28% over the normal rate. The only other subfield not to have seen a catastrophic collapse is history of science, down “just” 40%. This is clearly the Black Lives Matter moment playing itself out in the hiring patterns, and it produces some remarkable inversions; there are twice as many jobs listed for African-American history specifically as for American history generally.
The collapses in European and Middle East hiring are especially remarkable given that both fared quite badly after 2008, as well. A typical associate professor in mideast studies might have received her first job in 2008, when there were about 60 new jobs in mideast studies; this year, there is one.

Job losses have been unevenly distributed.
<th>Region</th> <th colspan="4" halign="left">Average Jobs listed by November 12</th> <th>as share of 2010s average</th> <th>as share of 2000s average</th> </tr> <tr> <th>era</th> <th></th> <th>2004-2008</th> <th>2009</th> <th>2010-2019</th> <th>2020</th> <th></th> <th></th> </tr> </thead> <tbody> <tr> <th></th> <td>Middle East</td> <td>61.20</td> <td>29.0</td> <td>21.9</td> <td>1.0</td> <td>5%</td> <td>2%</td> </tr> <tr> <th></th> <td>World</td> <td>37.80</td> <td>13.0</td> <td>14.5</td> <td>1.0</td> <td>7%</td> <td>3%</td> </tr> <tr> <th></th> <td>Europe</td> <td>88.40</td> <td>36.0</td> <td>46.1</td> <td>5.0</td> <td>11%</td> <td>6%</td> </tr> <tr> <th></th> <td>US/Canada</td> <td>162.80</td> <td>79.0</td> <td>68.2</td> <td>14.0</td> <td>21%</td> <td>9%</td> </tr> <tr> <th></th> <td>Ancient</td> <td>28.20</td> <td>16.0</td> <td>17.0</td> <td>3.0</td> <td>18%</td> <td>11%</td> </tr> <tr> <th></th> <td>Americas</td> <td>52.40</td> <td>26.0</td> <td>30.0</td> <td>7.0</td> <td>23%</td> <td>13%</td> </tr> <tr> <th></th> <td>Asia</td> <td>80.60</td> <td>43.0</td> <td>54.7</td> <td>14.0</td> <td>26%</td> <td>17%</td> </tr> <tr> <th></th> <td>Methodological</td> <td>25.20</td> <td>12.0</td> <td>30.4</td> <td>8.0</td> <td>26%</td> <td>32%</td> </tr> <tr> <th></th> <td>Africa</td> <td>13.00</td> <td>4.0</td> <td>20.8</td> <td>5.0</td> <td>24%</td> <td>38%</td> </tr> <tr> <th></th> <td>Hist. Sci.</td> <td>12.40</td> <td>7.0</td> <td>8.4</td> <td>5.0</td> <td>60%</td> <td>40%</td> </tr> <tr> <th></th> <td>Interdisciplinary</td> <td>15.20</td> <td>9.0</td> <td>25.4</td> <td>10.0</td> <td>39%</td> <td>66%</td> </tr> <tr> <th></th> <td>Black/Af-Am</td> <td>33.75</td> <td>20.0</td> <td>25.0</td> <td>32.0</td> <td>128%</td> <td>95%</td> </tr> </tbody></table>